Real-time monitoring device “panigraph” for bread fermentation with an Arduino-based data acquisition and management system
Abstract
Monitoring and evaluating fermentative performance of sourdough used in bakery products typically involves discontinuous, destructive and costly analyses, resulting in substantial data that is expensive to exploit using conventional methods. The performance of sourdough is determined by its capacity to efficiently leaven the dough in the briefest timeframe possible, while simultaneously reducing the pH to an optimal level. This pH reduction facilitates the activity of enzymes, notably phytases, which break down phytates. Additionally, sourdough has the ability to generate ethanol, a crucial element contributing to the flavor and shelf life of the bread. A new, low-cost, non-destructive device has been developed with a system for real-time data acquisition, monitoring, visualization, as well as data processing, consolidation, and storage, thus simplifying the study of sourdough performance. Multiple specific sensors were integrated into an Arduino Uno board and placed in a connected fermentation chamber controlled by computer-installed software. The developed device enables real-time monitoring of critical parameters during sourdough fermentation. These include dough rising DRC (cm), gas release (CO2, ethanol) (ppmv or ml), pH, conductivity (uS/cm), moisture (%) and dough mass loss (g). Additionally, it measures temperature (°C), air humidity (%) and pressure (mbar) within the fermentation chamber. The device generates graphs, facilitating visual comparisons of sourdough fermentative performance. This graphical representation makes it easy to determine the end of fermentation. The developed application facilitated the management and utilization of the sourdough database. The device enables researchers to save time, reagents and equipment that are usually dedicated to such analyses. It achieves this by offering continuous and simultaneous monitoring of various sourdough fermentation parameters, allowing for an assessment of their fermenting capacity.
Keywords: Sourdough, bread, fermentative capacity, data acquisition, monitoring
INTRODUCTION
Fermentation of dough is a crucial step in the production of bakery products. Monitoring and controlling the fermentation process is important for ensuring the quality of the final product. Various methods, ranging from standard techniques (Visual observation and chemical analysis) to advanced tools leveraging cutting-edge technologies (computer vision and acoustic technique), are available for monitoring the fermentation of bread dough (Giefer et al., 2019; Ivorra et al., 2014; Skaf et al., 2009). One approach is the use of thermodynamic sensors combined with an electronic nose, which can provide information about dough development based on its thermodynamic properties (Adamek et al., 2023). Another method involves the continuous measurement of pressure and temperature of the dough during fermentation using a device called “fermetron” (Nazeri et al., 2021). Additionally, an image analysis system has been evaluated for determining the volume increase of fermented dough pieces, allowing for the supervision of the fermentation process (Zuo, 2019). Furthermore, a dough fermentation control device and method have been proposed, which involve monitoring the mass and volume of the dough to accurately judge the fermentation process. These techniques enable the precise monitoring and control of dough fermentation, leading to improved quality and consistency of baked goods.
In addition, traditional methods are used, such as the use of the hydrolytic respirometer to measure CO2 production, as well as various analyses to measure the pH and titratable acidity of bread dough, require the use of chemicals and various analytical tools. They are both costly in terms of financial resources and time-consuming.
On the other hand, some new technologies offer undeniable advantages. They are fast, non-invasive, and require fewer financial resources for operation. However, their initial acquisition can be expensive, which limits their use on a large scale (Van Kerrebroeck et al., 2015). These authors reported that online control of fermentation processes using chromatography and/or spectrophotometry is a significant challenge, especially for the analy sis of volatile components. To the best of our knowledge, there are no published reports on the use of real-time monitoring devices for both physical and biochemical parameters during sourdough fermentation.
Microbiological and physico-chemical parameters are both employed to assess the fermentative capacity of sourdough. The complexity of analysis varies and depends on the purpose of the evaluation. The microbiological aspect primarily involves evaluating the community of lactic acid bacteria and yeasts (Böcker et al., 1995). However, a combination of phenotypic and genotypic methods is essential to identify the species/strain composition of both dominant and sub-dominant microbiota in sourdough (Hammes, 1991). The balance between lactic acid bacteria and yeast communities, as well as the composition of microbial communities in terms of species and strains, significantly influences sourdough performance and the overall quality of related leavened baked goods (Decock and Cappelle, 2005). The microbial community is influenced by certain sourdough characteristics, which, in turn, modify the chemical composition and physical parameters of the sourdough, ultimately impacting the overall quality of the products.
An overview of the physico-chemical characteristics related to sourdough performance is determined by evaluating parameters such as Dough Yield (DY), Dough Acidity (pH and Total Titratable Acidity, TTA), and Fermentation Quotient (FQ).
Furthermore, the fermentative capacity of sourdough is assessed by its capacity to leaven the dough expressed by Dough Rising capacity (DRC) or specific volume (cm3/g of dough), generate CO2 and ethanol, raise the Total Titratable Acidity (TTA), and reduce the final dough pH (Hammes, 1991). Therefore, the importance of employing the “panigraph” device for real-time monitoring of these parameters cannot be overstated. This tool facilitates the investigation of how variations in the following elements impact dough quality and rheology:
• The type of sourdough (Type 0, I, II, III, and IV),
• The sourdough composition,
• The nature and quantity of ingredients in the dough,
• The inclusion of enhancers,
• Kneading techniques,
• Fermentation temperature.
A notable advantage of a multi-sensor device is that it eliminates the need for chemical reagents in measurements. At the end of fermentation, the dough remains intact, allowing for immediate transfer to the baking stage to assess the bread’s quality through sensory tests.
The aim of this study was to create and validate a low-cost acquisition device, called “panigraph,” utilizing open-source IoT technology for the real-time monitoring of specific volatile compounds generated during sourdough fermentation. Simultaneously, it tracks various other parameters, including mass loss, dough rising, humidity, conductivity, fermentation temperature, proofing chamber pressure, and air humidity. This device is customizable and has the capability to monitor up to fourteen physical and chemical parameters concurrently, all without the need for chemical reagents, and at a minimal operating cost.
MATERIALS AND METHODS
Microcontroller
The Arduino Uno microcontroller (Figure 1) used in this project, is a widely used open-source microcontroller board designed for versatile electronic prototyping and experimentation. It is equipped with an ATmega328P microcontroller chip, providing an 8-bit processing platform. The board is characterized by its user-friendly interface, consisting of digital and analog input/output pins, which facilitate the connection of various sensors and actuators (Alarcon and Shene, 2022). Figure 1 shows the block diagram for the proposed data logger where it consists of microcontroller and multiple sensors.
Sensors
In modern scientific research and technological applications, sensors play a pivotal role in acquiring data and monitoring various environmental parameters. These sensors enable researchers and engineers to collect precise information critical for making informed decisions and ensuring the efficiency and safety of systems. The description of all sensors employed in our project are given below.
• MG-811 Carbon Dioxide (CO2) Sensor: The MG-811 is a gas sensor designed to detect and measure carbon dioxide (CO2) levels in the environment. It operates on the principle of non-dispersive infrared (NDIR) absorption, making it suitable for multiple applications. The sensor provides accurate CO2 concentration readings and can be integrated into various environmental monitoring systems such as fermentation process.
• MQ-3 Alcohol Gas Sensor: The MQ-3 is a gas sensor specifically designed for detecting alcohol vapor in the air. It is commonly used in breathalyzer devices and can also find applications in safety and security systems where alcohol detection is required. The sensor’s analog output varies with the concentration of alcohol in the surrounding atmosphere.
• BMP280 Barometric Pressure and Temperature Sensor: The BMP280 is a versatile sensor that measures both barometric pressure and temperature. It is often used in weather stations, altimeters, and other applications where accurate pressure and temperature data are essential. The sensor provides high precision and can operate in various environmental conditions.
• MQ-135 Air Quality Sensor: The MQ-135 is a gas sensor capable of detecting a range of gases, including ammonia, nitrogen oxides, and carbon monoxide. It is commonly used in air quality monitoring systems and can provide valuable information about indoor and outdoor air pollution levels. The analog output of the MQ-135 sensor varies with the concentration of the detected gas.
• HX711 Load Cell Amplifier: The HX711 is an amplifier module designed to interface with load cells and strain gauges. It provides precise amplification and digitization of weight measurements, making it suitable for applications such as weight scales, force measurement devices, and industrial automation systems. The HX711 communicates digitally and is commonly used with microcontrollers like Arduino.
• Infrared (IR) Proximity Sensor: An IR proximity sensor detects the presence or absence of an object by emitting and receiving infrared light. It measures the distance between the sensor and the object based on the reflection of the emitted IR light. These sensors are commonly used in robotics, motion detection systems, and industrial automation for object detection and positioning. This sensor was used to measure the dough’s rise by relying on the change in distance measured between the dough’s surface and the sensor.
• Conductivity Probe: Gravity: Analog Electrical Conductivity Sensor / Meter for Arduino. A conductivity probe, also known as an electrical conductivity sensor, is used to measure the electrical conductivity of a solution. It is widely employed in water quality analysis, hydroponics, and environmental monitoring to assess the concentration of dissolved ions or salts in a liquid. The sensor’s output is typically in units such as Siemens per meter (S/m) or microsiemens per centimeter (µS/cm).
• pH Probe Interface SEN0161: pH probes are used to measure the acidity or alkalinity of a product. The interface module used provide signal conditioning and amplification for the pH probe’s output, making it easier to integrate with Arduino.
• UV lamp (Philips T5 UVC): for sterilizing the interior of the incubator before the fermentation begins.
Data acquisition and storage
Data acquisition by Arduino is a fundamental aspect of its widespread application in scientific research, engineering, and various projects (Alarcon and Shene, 2022; Balkhaya et al., 2020; Küçükağa et al., 2022). Arduino, equipped with a range of analog and digital input/output pins, is adept at capturing data from sensors. This capability to interface with sensors and acquire data in real-time makes Arduino a versatile tool for monitoring and controlling processes, conducting experiments, and building smart, data-driven applications across numerous domains, from home automation to scientific experimentation and industrial automation. The data has been stored in a CSV file, which is readable in Excel and can be utilized by the application developed for the management and analysis of the bread fermentation performance evaluation experiments.
The Table 1 offers a detailed sequence of instructions for establishing a real-time monitoring system employing an Arduino Uno and various sensors. Each step is crucial in configuring the system, encompassing the initial sensor connections and the creation of a user-friendly data presentation within a computer application.
Data management and analytics
Methods
The design and development of software tailored for monitoring the fermentation process is a meticulous and multifaceted endeavor. It contains the following steps:
System Design
Once the requirements and features are established, the software’s architecture was designed. This step outlines the overall structure of the software, including the data acquisition process and user interface.
Language Selection
The choice of programming languages and development tools is critical. Common languages such as Python and C were selected to ensure compatibility with the hardware and data acquisition systems.
Development
This step involves writing the actual code for the software based on the design specifications. Developers create the user interface, implement data acquisition and processing algorithms, and establish connections with sensors and other hardware components.
Testing, validation and refinement
Rigorous testing and validation procedures were conducted to ensure that the device operates accurately and reliably in real-world fermentation situations. This includes verifying that it correctly captures and processes data and effectively responds to user inputs. The sensors have been calibrated, and their values for various parameters have been cross-verified with other standard laboratory equipment or against known concentrations in the ambient air, particularly for CO2.
Deployment
Once the software is thoroughly tested and refined, it is deployed in the fermentation process, where it actively monitors and records data during bread production.
Materials
• Tools and Technologies
Hardware Environment: Laptop
Integrated Development Environment (IDE): Visual Studio Code
Database Management System: MySQL Workbench
UML Modeling Tool: Visual Paradigm
Dashboard Template: Django Admin Dashboard
Version Control System: GitHub
Web Hosting: Python Anywhere
• Programming Languages: Python, C, HTML, CSS, Javascript
• Frameworks and Libraries: Django, Pandas, Chart.js, Bootstrap, jQuery
Raw material
The composition of the liquid leavens used in the validation tests during the work cited by Raffak (Raffak et al., 2023) is given in Table 2.
Preparation of Bread Dough
The composition of the doughs is provided in Table 3; each dough weighed 220 g.
CO2 and Ethanol Release
The quantity of gases (CO2 and ethanol) released during the fermentation process is measured in real time by sensors installed inside the panigraph. Based on the volume concentration values measured, their respective outputs were calculated using the following formula (Zhang et al., 2007):
Gas released (L/Kg) = Gas concentration (ppmv) × Volume (m3) / mass of dough (Kg) (1)
Dough Rising (cm)
This parameter was measured directly by a device set up to calculate the dough’s rising capacity (DRC), following the formula mentioned by Bhatt and Gupta (2015). A minor modification was made, which involved substituting ‘volume’ with ‘dough height’. the rise of the dough is measured by the Infrared (IR) Proximity Sensor installed inside the oven.
DRC (%) =(final height-initial height)/initial height (100) (2)
Dough fermentation temperature and duration
The temperature inside the oven during dough fermentation was set to 30 °C for all tests, and the maximum duration of fermentation was limited to 1440 min.
pH monitoring
The pH of the dough was monitored using the pH Probe Inter-face SEN0161, which is immersed in the small pyrex beaker containing the dough.
Conductivity monitoring
Dough conductivity was monitored during fermentation using the Gravity Analog Electrical Conductivity Sensor, which is immersed in the same pyrex beaker as the pH meter containing the dough.
Lossed mass monitoring
Dough mass loss was measured continuously by the HX711 Load Cell Amplifier installed inside the oven.
RESULTS AND DISCUSSION
Bread Baking Monitoring Device (Panigraph)
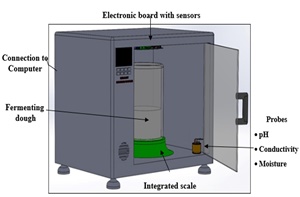
The developed monitoring system comprises a device composed of multiple sensors integrated into an electronic board housed within a sealed chamber. This system facilitates the continuous monitoring of around ten parameters related to bread fermentation, enabling the assessment of the performance of various types of traditional or industrial yeast cultures, all at an extremely low cost (Figure 2 and Figure 3). The efficiency of monitoring and controlling various parameters in bread fermentation experiments can be improved with minimal cost and without the need for consumables or chemicals. The Panigraph device developed provides a cost-effective and user-friendly alternative to equipment such as FTIR, HPLC, and GC-MS.
The potential of the Panigraph as an online monitoring device for food fermentations has been tested in the works of Raffak and Chafai (Chafai et al., 2023; Raffak et al., 2023) allowing for the assessment of the fermentative capacity of sourdough and highlighting the importance of real-time monitoring of the sourdough fermentation process. In this regard, a series of simulations and tests were conducted to validate and ensure the reproducibility of the results obtained. Previous published studies used this innovative device (Chafai et al., 2023; Raffak et al., 2023).
The Panigraph generates graphs that include the main parameters used to characterize sourdoughs and assess their fermentative capacity. The fermentation data primarily includes dough rising, gas release (CO2 and ethanol), loss of mass during fermentation, and pH kinetics.
Monitoring dough rise during dough fermentation
Yeast is the main species responsible for dough rising (Raffak et al., 2023). This rising resulting from the expansion of the dough, is continuously and directly measured by the device during fermentation using an Infrared (IR) Proximity Sensor to calculate the dough rising capacity (DRC) expressed in (cm) (Raffak et al., 2023). This enabled the creation of the curves shown in Figure 4.
Figure 4 accurately allowed the determination of the end of the fermentation for each sourdough and the comparison of their fermentative capacity in terms of dough rising and time making to fermented the dough. The end of fermentation corresponds to the flattening of the curves. Sourdoughs with a dough rising capacity (DRC) exceeding 100% are capable of producing bread dough.
Monitoring of CO2 release during dough fermentation
In sourdough bread, both yeast and lactic acid bacteria produce CO2, it is responsible for leavening the dough. The curves in Figure 56 allowed for the determination of the quantities and rate of CO2 released during the course and at the end of the dough fermentation process (Table 1).
Monitoring dough pH kinetics during dough fermentation
The decrease in pH in the dough is attributed to the production of biogenic acids, notably lactic and acetic acid by microorganisms, along with carbon dioxide produced by yeast. This acidifying capacity is the primary metabolic property sought in lactic acid bacteria. Figure 6 illustrates the decline in dough pH during fermentation.
The pH of the sourdough impacts the pH values of the final dough and bread, with variations depending on the quantity of full sourdough used as the inoculum. When a standard inoculum of 20% (relative to the dough weight) is employed, pH values in the final dough typically range from 4.7 to 5.4 (Esteve et al., 1994). The final pH, falling within the range of 3.5 to 4.3, is commonly regarded as an indicator of well-developed sourdough fermentation (Esteve et al., 1994).
Individual panigram of sourdough
The curves obtained from the panigraph during the fermentation of a dough can be combined into a single graph (panigram) to characterize the studied starter. The individual panigram (Figure 7) allows for the direct reading of the main baking parameters on the same graph, which constitutes a visual footprint that allows for reading the fermentative performance of a sourdough and comparing it to other ones.
Determination of fermentation parameters
The monitoring of the fermentation process has enabled the determination of the key baking parameters at the end of fermentation, based on the dough’s rise. Indeed, from the curves in Figure 6, these main parameters can be deduced (Table 4).
Vertical panigram of sourdough
The data in the Table 4 made it possible to draw the vertical panigram (Figure 8) in order to visually compare the fermentation performance of several sourdoughs.
The vertical panigram offers a means to simultaneously compare the fermentative performance of multiple sourdoughs. This graph serves as a convenient tool for plotting the key fermentation parameters, presenting a visual and numerical fingerprint that facilitates the comparison of various sourdoughs in subsequent analyses.
Bread Fermentation Management and Analysis System (BFMAS)
The Bread Fermentation Management and Analysis System (BFMAS) is a specialized application designed to optimize the functionality of the Panigraph monitoring system. This solution serves to streamline the entire process of managing, acquiring, processing, visualizing, and consolidating data related to bread fermentation. BFMAS excels in efficiently managing various aspects of the fermentation process, including sourdoughs formulation, refreshments, and overall fermentation. It seamlessly acquires and analyzes fermentation data in an intuitive manner, providing a user-friendly interface that simplifies both the exploration and utilization of the gathered information. This comprehensive system enhances the overall efficiency and effectiveness of bread fermentation monitoring.
The features of the BFMAS
The newly developed application empowers users to execute a range of management operations, enhancing overall control and efficiency in various aspects of the bread fermentation process. Table 5 provides a detailed overview of the functional requirements and modules embedded within the application, each serving a specific purpose in facilitating a comprehensive bread fermentation management system.
User interface of BFMAS
The application that has been developed provides a convenient and accessible online platform for users, offering secure access through a login and password system. This online accessibility allows for flexibility and convenience, enabling authorized individuals to log in and utilize its various features. With this system in place, users can securely manage and analyze data, perform real-time monitoring of fermentation processes, and visualize kinetic curves related to bread production, refreshments, starters, and the ingredients used. This online accessibility not only enhances the convenience and ease of data management but also ensures data security and privacy, making it a valuable tool for various industrial and laboratory applications.
An application has been developed to manage and consolidate the vast data generated by the Panigraph, allowing real-time data acquisition and visualization of kinetic curves related to fermentation, including tests, refreshments, starters, and ingredient usage.
CONCLUSION
The present work focuses on a new device based on an open-source control board (Arduino Uno) that is reliable and cost-effective for monitoring fermentation, particularly in the context of bread fermentation and the assessment of performance experiments for various types of sourdoughs. This device comprises three modules: a monitoring module, a data acquisition module, and a data processing module.
The Panigraph generates multi-axis graphs (individual and vertical panigrams) that encompass the primary parameters utilized for characterizing sourdoughs and evaluating their fermentative performance. The fermentation data includes, at a minimum, dough rising DRC (cm), specific volume (cm3/g), gas release (CO2 and ethanol) (ml or ppmv), temperature (°C), pressure (mbar), loss of mass during fermentation (g), air and dough humidity (%), and dough conductivity (μS/cm).
The data acquisition module was used to receive the fermentation data acquired by the monitoring module, enabling storage, analysis, and processing of fermentation data, as well as the plotting of fermentation curves for different repetitions. The efficiency of monitoring and controlling various parameters of bread fermentation and baking experiments can be enhanced with minimal additional cost and without the need for consumables or chemicals.
The Panigraph device developed offers a cost-effective and user-friendly alternative to equipment such as FTIR, HPLC, and GC-MS, making it suitable for monitoring various industrial and laboratory applications, particularly in the study of fermentative capacity during sourdough production and solid-state fermentation. In a more general sense, it was designed for monitoring solid or semi-solid fermentation processes.
REFERENCES
Adamek, M., Zvonkova, M., Buresova, I., Buran, M., Sevcikova, V., Sebestikova, R., Adamkova, A., Skowronkova, N., Mlcek, J. (2023). Use of a thermodynamic sensor in monitoring fermentation processes in gluten-free dough proofing. Sensors, 23: 534.
Alarcon, C., Shene, C. (2022). Arduino Soft Sensor for Monitoring Schizochytrium sp. Fermentation, a Proof of Concept for the Industrial Application of Genome-Scale Metabolic Models in the Context of Pharma 4.0. Processes, 10:11.
Balkhaya, B., Ilham, D. N., Candra, R. A., Hasbaini, H., Anugreni, F. (2020). Designing an Arduino-based Automatic Cocoa Fermentation Tool. Sinkron: jurnal dan penelitian teknik informatika, 5: 92‑99.
Bhatt, S. M., Gupta, R. K. (2015). Bread (composite flour) formulation and study of its nutritive, phytochemical and functional properties. Journal of Pharmacognosy and Phytochemistry, 4: 254‑268.
Böcker, G., Stolz, P., Hammes, W.P. (1995). Neue Erkenntnisse zum Ökosysyem Sauerteig und zur Physiologie des sauerteig-typischen Stämme Lactobacillus sanfrancisco und Lactobacillus pontis. Getreide Mehl und Brot, 49:370–374.
Chafai, Y., Raffak, A., El-Aalaoui, M., Sbaghi, M., Djerrari, A., Zahar, M. (2023). Valorization of prickly pear peels and seed press-cake in traditional sourdoughs and evaluation of their bread-making capacities. Journal of Microbiology, Biotechnology and Food Sciences, e9744‑e9744.
Decock, P., Cappelle, S. (2005). Bread technology and sourdough technology. Trends Food Sci. Tech., 16:113–120.
Esteve, C.C., Barber, C.B., Martínez-Anaya, M.A. (1994). Microbial sour doughs influence acidification properties and breadmaking potential of wheat dough. Journal of Food Science, 59: 629‑633.
Giefer, L.A., Lütjen, M., Rohde, A.-K., Freitag, M. (2019). Determination of the optimal state of dough fermentation in bread production by using optical sensors and deep learning. Applied Sciences, 9: 20.
Hammes, W.P. (1991). Fermentation of non-dairy food. Food Biotech., 5:293–303.
Ivorra, E., Amat, S.V., Sánchez, A.J., Barat, J. M., Grau, R. (2014). Continuous monitoring of bread dough fermentation using a 3D vision Structured Light technique. Journal of Food Engineering, 130: 8‑13.
Küçükağa, Y., Facchin, A., Torri, C., Kara, S. (2022). An original Arduino-controlled anaerobic bioreactor packed with biochar as a porous filter media. MethodsX, 9: 101615.
Nazeri, F. S., Kadivar, M., Izadi, I. (2021). A sensing system for continuous monitoring of bread dough during fermentation. Sensing and Imaging, 22: 1‑22.
Raffak, A., Chafai, Y., Hamouda, A., Mounir, M. (2023). Suivi en temps réel de la fermentation panaire de quatre levains liquides à base des farines du blé tendre, du blé dur complet, du baobab et du Millet. Revue Marocaine des Sciences Agronomiques et Vétérinaires, 11: 259‑268.
Skaf, A., Nassar, G., Lefebvre, F., Nongaillard, B. (2009). A new acoustic technique to monitor bread dough during the fermentation phase. Journal of Food Engineering, 93: 365‑378.
Söderby, K. (2023). Getting Started with Arduino | Arduino Documentation. https://docs.arduino.cc/learn/starting-guide/getting-started-arduino.
Van Kerrebroeck, S., Vercammen, J., Wuyts, R., De Vuyst, L. (2015). Selected ion flow tube–mass spectrometry for online monitoring of submerged fermentations: a case study of sourdough fermentation. Journal of Agricultural and Food Chemistry, 63: 829‑835.
Vrancken, G., Rimaux, T., Weckx, S., Leroy, F., De Vuyst, L. (2011). Influence of temperature and backslopping time on the microbiota of a type I propagated laboratory wheat sourdough fermentation. Applied and Environmental Microbiology, 77: 2716‑2726.
Xiong, M., Wang, D., Zuo, T., Liang, S., Liu, M. (2019). Dough fermentation control method, system and fermentation device and control method thereof (Brevet CN109315454A).
Zettel, V., Paquet-Durand, O., Hecker, F., Hitzmann, B. (2016). Image analysis and mathematical modelling for the supervision of the dough fermentation process. AIP Conference Proceedings, 1769(1).
Zhang, L., Lucas, T., Doursat, C., Flick, D., Wagner, M. (2007). Effects of crust constraints on bread expansion and CO2 release. Journal of Food Engineering, 80: 1302‑1311.
Zuo, T. (2019). Dough fermentation control device and method and cooking appliance (Brevet CN110278974A).