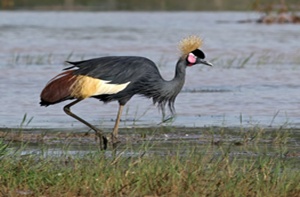
Abstract
Sahelian wetlands are undergoing rapid transformation under the combined effects of climate change and human pressures, leading to the progressive degradation of wildlife habitats. This study analyzes the impact of land-use dynamics on the habitat of the Crowned Crane (Balearica pavonina) in a transboundary area between 1986 and 2026. The methodological approach combines remote sensing, spatial analysis, and phytosociological surveys. Land cover maps were produced from Landsat TM, ETM+, and OLI/TIRS imagery using supervised classification based on the Maximum Likelihood algorithm. Vegetation analysis is based on 54 phytosociological surveys conducted in six land cover units using the Braun-Blanquet sigmatist method. The results show an overall classification accuracy of 83.2% with a Kappa index of 0.81, indicating high reliability of the maps produced. Between 1986 and 2026, shrub savannas (18.1% to 43.7%) and wooded savannas (8.6% to 24.8%) experienced significant expansion, while permanent ponds (24.9% to 1.4%) declined. Transition analyses reveal a progressive conversion of wetlands to savanna formations and human-modified areas. Spatial modeling highlights a concentration of hotspots and ecological corridors in the southwest sector along the Komadougou River. The abundance of the Crowned Crane is significantly linked to environmental variables, including NDVI, NDWI, and distance to water. Phytosociological analysis identifies four distinct plant communities, with wetlands exhibiting the highest floristic diversity. This study shows that wetland degradation and ecological fragmentation constitute major threats to the conservation of Balearica pavonina in the Sahelian landscapes.
Keywords: Spatio-temporal dynamics, Ecological corridors, Niger
INTRODUCTION
Land-use dynamics are now one of the main direct and indirect drivers of biodiversity loss worldwide (IPBES, 2019). These dynamics result primarily from the intensification of human activities, including agricultural expansion, urbanization, deforestation, and the overexploitation of natural resources, which profoundly alter the structure and functioning of ecosystems (Foley et al., 2005; Lambin and Geist, 2006). These changes lead to the progressive fragmentation of natural habitats, a reduction in their ecological connectivity, and an alteration of ecosystem services essential for maintaining animal and plant populations (MEA, 2005).
In tropical and Sahelian regions, these dynamics are particularly pronounced due to the strong dependence of human populations on natural resources and climate variability (Boussougou, 2017). The Sahel, an ecological transition zone between the Sahara and the Sudanese savannas, is subject to recurring drought cycles, increasing population pressure, and rapid expansion of agricultural land (Herrmann et al., 2014). These combined factors have led to an accelerated transformation of natural landscapes into agro-pastoral mosaics, often at the expense of wildlife habitats (Taugourdeau, 2024).
The Lake Chad Basin is a prime example of these transformations. Historically one of Africa’s largest lake systems, it has experienced a dramatic reduction in surface area since the 1960s, accompanied by profound changes in the surrounding wetlands (Coe and Foley, 2001; Leblanc et al., 2011). This dynamic results from both natural climate variations and increasing human pressures, including irrigation, land conversion, and water resource exploitation (IPBES, 2019; FAO, 2020). Consequently, aquatic and semi-aquatic habitats, essential for many species, have been severely degraded and fragmented. Among the species particularly sensitive to these changes is the Balearica pavonina. This emblematic species of African wetlands is closely linked to open landscapes, floodplains and water-land transition zones (BirdLife International, 2020; IUCN, 2022).
It is highly dependent on water availability, vegetation quality, and habitat connectivity to perform its vital functions, including feeding, reproduction, and seasonal movements (Urban et al., 1986; Meine and Archibald, 1996). As a gregarious species sensitive to environmental disturbances, it is often considered a relevant biological indicator of the ecological status of African wetlands. However, habitat degradation linked to land-use changes poses a major threat to the survival of this species (BirdLife International, 2020; IUCN, 2022; IPBES, 2019).
The expansion of agricultural land, overgrazing, vegetation clearing, and the draining of wetlands contribute to the reduction and fragmentation of natural habitats (Hansen et al., 2013). This fragmentation leads to decreased ecological connectivity between suitable sites, limiting movement, genetic exchange, and access to essential resources. In Sahelian contexts, these effects are exacerbated by hydrological fluctuations and recurring droughts, which increase habitat instability (Giannini et al., 2008). Recent studies show that landscape structure plays a crucial role in the distribution of wetland-dependent species. The spatial configuration of habitats, their size, shape, and degree of isolation directly influence the viability of animal populations.
Approaches based on remote sensing and geographic information systems (GIS) now make it possible to analyze these dynamics at different spatial and temporal scales, using biophysical indicators such as NDVI (Normalized Difference Vegetation Index) and the NDWI (Normalized Difference Water Index) to characterize vegetation and water surfaces.
Despite these methodological advances, knowledge remains limited regarding the relationships between land-use dynamics, habitat quality, and ecological connectivity in Balearica pavonina, particularly in the transboundary areas of Niger and Nigeria. These regions are critical for the species’ conservation due to the coexistence of intense human pressures and the presence of still-functional habitats. A better understanding of these interactions is therefore essential to guide conservation policies and sustainable landscape management. In this context, the present study aims to analyze the impact of land-use changes on the habitat of Balearica Pavonina in a cross-border context.
It relies on an integrated approach combining remote sensing, spatial analysis, and ecological modeling. This study analyzes the impact of land-use dynamics on the habitat of the Crowned Crane (Balearica pavonina) in a cross-border area between 1986 and 2026.
METHODOLOGY
Study area
The study area is located in southeastern Niger, in the Diffa region, within the Komadougou basin Yobé, on the Niger–Nigeria border. It covers an area of 122 km², corresponding to the main area of occurrence of the Crowned Crane (Balearica pavonina). The landscape is characterized by a mosaic of temporary and permanent ponds, gallery forests, shrubby and wooded savannas, and irrigated agricultural areas.
The climate is semi-arid tropical Sahelian with a short rainy season and a long dry season, average annual rainfall of 381 mm, and high temperatures frequently exceeding 40°C. The landscape is dominated by alluvial plains and hydromorphic depressions associated with the Komadougou River system. The soils are primarily clayey, sandy, or sandy-loamy, favorable to the development of wetlands. This area plays a major ecological role in the conservation of Sahelian biodiversity and constitutes an essential habitat for the Crowned Crane thanks to the seasonal availability of water and vegetation resources. However, it is subject to strong anthropogenic pressures related to agricultural expansion, overgrazing, logging, and climate fluctuations, leading to the progressive fragmentation of natural habitats and the alteration of ecological corridors (Figure 1).
Mapping data
Satellite imagery from Thematic Mapper (TM4) sensors for 1986, Landsat 7 ETM+ (Enhanced Thematic Mapper Plus) for 2000, and Landsat 8 OLI TIRS for 2022 and 2026 was used. A scene from four different dates was downloaded from https://eartexplorer.usgs.gov/, with less than 3% cloud cover. This data was used to create land cover maps of the Crowned Crane’s range for 1986, 2000, 2022, and 2026 (Table 1). Bands 5 and 4 of Landsat 8 and bands 4 and 3 of Landsat 4 were used to calculate NDVI and NDWI. The dates chosen correspond to the observation periods of the species in the study area. The Crowned Crane was observed in the area in 1986, before disappearing in 2000. It was then observed again in 2022 and 2026.
Vegetation data
Stratified random sampling was conducted through the establishment of 50 m × 20 m (1000 m²) plots in six (6) land cover units. In each plot, phytosociological surveys were also carried out to characterize the organization of plant communities. The Braun-Blanquet sigmatist method (1932) was used, in accordance with practices adopted in several studies conducted in Niger (Mahamane, 2005; Boulweydou, 2008; Morou, 2010; Inoussa, 2011; Soumana, 2011). This method is based on the analysis of floristic composition, the inventory of which constitutes a fundamental tool for assessing biological diversity (Schwal, 2004).
The abundance-dominance coefficients assigned to the species are as follows:
• 5: species covering 75 to 100% of the survey area;
• 4: 50 to 75%;
• 3: 25 to 50%;
• 2: 5 to 25%;
• 1: 1 to 5%;
• + : less than 1%.
Abundance indicates the relative proportion of individuals of a species in a given survey, while dominance reflects the area of land it occupies.
Extraction of the study area
The study area was delineated using a 30 m SRTM digital elevation model (DEM) available on the Google Earth Engine (GEE) platform. After correcting the DEM to remove artificial wells, the surface water flow direction was calculated. The sub-basin’s main outlet point was located using its precise geographic coordinates. Using Google Earth Engine’s watershed calculation function, the area draining to this outlet was extracted as a raster and then converted into a polygon. This vector file represents the entire precise spatial boundary of the Crowned Crane area and was exported for subsequent geospatial analyses.
Colorful composition
Color compositing allows for the production of color images that take into account the spectral signature of objects. Its primary purpose is to distinguish the different objects present in the images, thereby facilitating image interpretation. After several combinations, the color composition of bands 4 (red), 3 (green), and 2 (blue) from Landsat 4 (TM) and Landsat 7 (ETM+) for the years 1986 and 2000, and the color composition of bands 5 (red), 4 (green), and 3 (blue) (5R, 4V, 3B or 5,4,3) from Landsat 8 OLI TIRS for the years 2022 and 2026 were used respectively to discriminate the different land cover units in the study area, as it provides the best discrimination of land cover types (Chatelain, 1996; Girard and Girard, 1999; Oszwald, 2005; Kpedenou et al., 2017).
Supervised classification
In supervised classification, image analysis is a process that categorizes pixels by specifying a computer algorithm based on numerical descriptors specific to the different land cover types present in satellite scenes. To do this, representative samples of known sites, called training plots, are used to determine the spectral signatures characteristic of each class. These signatures serve to describe the spectral attributes specific to each land cover type.
The training sites were delimited far from the transition zones to avoid including mixed pixels. The size of the training site must be greater than the localization error and smaller than the object to be detected (Kioko and Okello, 2010). It was estimated using the following formula:
With A = the area of the training site; P = pixel size in meters; L = localization accuracy in meters.
In this study, the chosen parametric algorithm is Maximum Likelihood Classification (MLC), which assumes a normal distribution of data for each class. This algorithm is particularly relevant for optimizing the value of the extracted information and designing an efficient data collection strategy by minimizing classification uncertainty (Gordon and Shortliffe, 1985; Ronald, 2020). GPS points collected in the field were overlaid on the pixels to facilitate the identification of land cover categories.
Evaluation of the classification quality
The validation of this classification using ground truth was limited to the 2026 maps. To verify the reliability of these maps, control points were established using GPS in each land cover unit and compared with the actual ground conditions. This allowed for verification of their agreement and calculation of the overall accuracy of each map in the field (Chalifoux et al., 2006). Thus, for each classification, common and widely used measures such as the overall accuracy index, the Kappa coefficient, and the overall ground accuracy were calculated (Hanania et al., 2022).
Overall accuracy: This refers to the percentage of correctly classified pixels relative to the total number of validation pixels. It is calculated as follows:
Where a ii is the number of correctly classified pixels for class i, and N is the total number of validation pixels.
Kappa coefficient (κ): it measures the level of agreement between the classification and the reality on the ground, taking into account agreements due to chance.
With Po : proportion of observed agreement,
Pe : proportion of agreement expected by chance.
Overall field accuracy (or field validation accuracy): This is the accuracy estimated by comparing the classification results with observations made directly in the field, or via very high-resolution data. It is generally presented as a confusion matrix, which also allows for the calculation of:
Producer accuracy (Fidelity to field reality): percentage of pixels of a reference class well identified by the classification.
User accuracy (Reliability of mapped class): reliability of a class as it appears on the map.
With:
aii: number of pixels correctly classified in class i,
: Total number of pixels of the real class i (row i of the confusion matrix),
n: total number of classes.
Analysis of land use dynamics
The transition matrix highlights the different forms of conversion that landscape units have undergone between two years. The areas of these different classes of landscape units were calculated from the intersection of land cover maps (interset) from 1986 to 2000, from 2000 to 2022 and from 2022 to 2026 using the ArcGIS 10.8 extension. (Hanania et al., 2022).
Conversion rate
The conversion rate of a land cover class corresponds to the degree of transformation undergone by that class when converting to other classes (Arouna, 2012). Changes in land cover were assessed by comparing the area of land cover units in different years. This rate quantifies the changes observed at the level of a land cover unit between two years. It is calculated from the transition matrix using the following formula:
With, Tc: conversion rate; Sit: Area of landscape unit i at initial date t and Sis: Area of the same unit remaining stable at date t1.
Degradation rate
The rate of degradation for each of the three periods 1986 to 2000, 2000 to 2022, and 2022 to 2026 was calculated from land cover class area data. The formula described by the FAO (1996) and used by Biaou et al. (2017) was used. This degradation rate Td is expressed as a percentage (%) of area/year according to the formula:
With Td: the rate of degradation; A1 and A2: the initial and final areas of the land cover units and t: the time interval in which we want to evaluate the changes in land cover, i.e. the three periods.
Channon ‘s Diversity Index
Legendre (1998) proposes the use of anthropy H as a diversity index. The Alpha diversity index or Shannon-Weaver diversity index (1949) was calculated using the following formula (Magurran, 2004; Shannon and Weaver, 1949):
H values are expressed in bits and range from 1 to more than 4. It is: low (0; 2.5), medium (2.5; 4); and high (greater than 4) (Morou, 2010). It assesses diversity within groups (Dajoz, 2003; Frontier et al., 2008).
Pielou's evenness (1969), or regularity, assesses the weight of each species in the use of space (Magurran, 2004; D’Avignon et al., 2000). It is higher when a large number of species contribute to the cover (Grall and Coïc, 2005). Pielou's evenness results from the ratio between actual diversity and theoretical diversity (Ben Moustapha et al., 2016; Huston, 1994; Dajoz, 2003; Frontier et al., 2008; Masharabu et al., 2010).
The index value ranges from 0 (one species is far more dominant than all others) to log2 S (when all species have the same abundance), where S is the number of species. E < 0.6 = low; 0.6 ≤ E ≤ 0.7 = medium; E ≥ 0.8 = high.
Biological and phytogeographic spectra
Biological spectra: These allow us to observe species in their different life forms and provide insight into ecological conditions. The identification of species biological types was based on the work of Raunkiaer (1934) (Birane et al., 2019). Seven (7) biological types were thus identified:
• Phanerophytes (Ph): higher plants whose renewal buds are located more than 50 cm above the ground. They are subdivided into:
- Microphanerophytes (mp): Tree 2 to 8 m tall,
- Nanophanerophytes (np): from 0.5 to 2 m in height,
- Mesophanerophytes (mP): from 8 to 30 m in height.
• Therophytes (Th): These are annual plants that form their spores or seeds during a single life stage. They are subdivided into:
- Liane Thérophytes (Lth): therophytic lianas
-Th: herbaceous therophytes,
• Hydrophytes (Hy): aquatic plants whose persistent buds are located at the bottom of the water;
• Geophytes: plants whose renewal buds are buried in the soil.
We can distinguish:
- GB: Bulbous geophytes
The raw and weighted biological spectra are determined respectively from the number and frequency of each biological/phytogeographic type.
The raw spectrum was calculated from the expression:
With ni the number of species (having the same biological type; same phytogeographical types), N is the total number of all species recorded.
The weighted spectrum was determined according to the formula:
With Rmi, the average cover of each species (having the same biological types; same phytogeographical types).
NRm is the number of readings; pi is the proportion of the different species.
Statistical analyses
The analysis of the floristic structure of the habitats was carried out using a Principal Component Analysis (PCA) applied to the presence-absence matrix of species in order to identify the dominant plant communities and ecological gradients.
The relationships between species abundance and environmental variables (NDVI, NDWI, and distance to water) were analyzed using independence tests to identify factors influencing species distribution. All cartographic and spatial processing was performed using ArcGIS 10.8 software, while statistical analyses were carried out using R software.
RESULTS
Land use maps for the years 1986, 2000, 2022 and 2026
The mapped area, covering 122 km², has a spatial structure characterized by a mosaic of six land cover units identified over different periods (1986, 2000, 2022, and 2026). These units include temporary ponds, permanent ponds, gallery forests, shrub savannas, wooded savannas, and the irrigated crop zone (Figure 2). The reliability analysis yielded an overall accuracy of 83.2% and a Kappa coefficient of 0.81, indicating near-perfect agreement for the quality of image interpretation. All land cover units achieved higher accuracy rates (>82%).
Spatio-temporal dynamics of land cover units in the Crowned Crane occurrence zone
Analysis of land cover dynamics in the Crowned Crane’s range between 1986 and 2026 shows an expansion of shrub savanna (18.1%; 43.7%), wooded savanna (8.6%; 24.8%), gallery forest (9.6%; 16.3%), and temporary ponds (4.2%; 22.7%). Conversely, irrigated farmland (34.6%; 12.1%) and permanent ponds (24.9%; 1.4%) exhibited a regressive dynamic (Table 2).
Changes in land use units between 1986, 2000, 2022 and 2026
Changes in land cover units between 1986 and 2000 are shown in the transition matrix in Table 3. Temporary ponds remained unchanged at 27.4%, while 27.8% were converted into permanent ponds and 38.8% into galleries forests, and 5.92% to other units. Permanent ponds show 40.0% stability, 28.1% conversion to shrubby savannah, and 16.3% to gallery forest, 15.2% in wooded savannah. The galleries Forests remained unchanged at 1.50%, while 31.9% transitioned to wooded savannah, 23.9% to shrubby savannah, and 19.0% to permanent ponds. Shrubby savannah retained 4.07%, with 29.7% transitioning to permanent ponds and 24.9% to irrigated ponds crops. Wooded savannah shows 2.35% stability, 40.1% is transformed into shrubby savannah, 24.6% in irrigated area crops. The irrigated crops remained at 9.07%, with transitions of 38.0% to permanent ponds, 31.5% to temporary ponds (Table 3).
Changes in land cover units within the Crowned Crane’s area of occurrence between 2000 and 2022 are shown in the transition matrix presented in Table 4. Temporary ponds show 33.4% stability, while 27.2% transition to permanent ponds. Permanent ponds remain at 6.59%, with dominant transitions to temporary ponds (38.9%) and wooded savannah (26.1%) (Table 4).
The galleries Forests remained unchanged at 42.2%, with conversions to shrubby savannah (23.1%) and permanent ponds (14.6%). Shrubby savannah showed 4.86% stability, with transitions to irrigated areas. crops (27.9%), the gallery forests (28.7%). Wooded savannah remained unchanged at 39.0%, while 26.3% are evolving towards temporary ponds. Irrigated crops show 48.3% stability, transformed into shrubby savannah (16.3%), temporary ponds (15.4%), wooded savannah (13.3%), galleries forests (5.36%) and permanent ponds (1.27%) (Table 4).
The dynamics of land cover units between 2022 and 2026 are presented in the transition matrix in Table 5. Temporary ponds show a retention rate of 2.96%, while 70.7% are converted to shrubby savannah and 22.9% to gallery forest. forest. The permanent ponds are transformed into a gallery forests (48.9%) and temporary ponds (43.7%). The gallery Forests show 21.1% stability, with conversions to shrubby savannah (60.0%). Shrubby savannah is maintained at 62.8%, while 24.8% evolves into wooded savannah. Wooded savannah shows 29.8% stability, transforming into irrigated crops (30%). The irrigated crops remained at 18.7%, with conversions to wooded savannah (59.0%) (Table 5).
Spatial analysis of habitat hotspots and ecological corridors
Spatial analysis reveals heterogeneity in the distribution of occurrence hotspots and corridors for the Crowned Crane within the study area. Hotspot modeling (Figure 3, Left) shows a maximum concentration located in the southwest sector, along the Komadougou river system, with values ranging from 26.9% to 35.3% in the vicinity of Teguessa and Guoa. Moving away from this area, occurrence values gradually decrease, reaching levels between 1.70% and 5.85% in the east and north sectors, particularly towards Feo Koura, Fougouri, and Guessere. Corridor modeling (Figure 3, Right) highlights two main areas of high permeability, with values ranging from 25.0% to 30.5%. The first is located in the southwest sector, corresponding to the area of high occurrence. The second is located in the north, around Djalori. The eastern and western margins of the study area show the lowest values for both parameters, with corridor indices ranging from 2.78% to 13.9%.
Species-environment relationships and water dependence of the Crowned Crane
The independence test of ecological relationships between species abundance and the main environmental gradients (NDVI, NDWI, and distance to water) shows a dependence (P-value = 0.006) between species abundance and water conditions and vegetation quality. Abundance increases significantly (P = 0.003) with NDVI, indicating that sites with high plant productivity offer more favorable conditions in terms of food resources and habitat cover. A similar trend is observed with NDWI, where high surface moisture values are associated with high abundance, reflecting the importance of wetlands in the species’ distribution. Finally, the relationship with distance to water is strongly negative, with abundance decreasing rapidly with increasing distance from water sources, confirming a strong functional dependence on water resources (Figure 4).
Identification of plant communities
To individualize plant communities, all 54 surveys and 88 species were subjected to Principal Component Analysis based on the presence/absence criterion of species in the surveys. Figure 5 shows the arrangement of land cover units in the factorial plane of axes 1 and 2, with a contribution of 34.9% for axis 1 and 28.8% for axis 2. This combination absorbs on average 31.8% of the total variability and shows a very clear separation along axis 1, the land cover units of the communities (G1: Temporary and permanent ponds), and axis 2, the land cover units for the communities (G2: Galleria forest; G3: Tree and shrub savanna; and G4: Irrigated cultivated area). This partition allows us to interpret the combined action of hydrological, edaphic and anthropogenic factors that structure land cover units (Figure 5).
Floristic characteristics of plant communities
Principal Component Analysis (PCA) reveals an ecological characterization of the Crowned Crane’s habitat, with the first two axes explaining 62.7% of the total variance (Dim1 = 34.7% and Dim2 = 28%). Group G1 characterizes a gradient of wetlands, including temporary and permanent ponds. Flora analysis highlights a dominance of Cyperaceae (35%), with hydrophytes (HY: 56.23%) and microphanerophytes (mp: 57.34%) being the most abundant and dominant biological types. B. rufescens and Cyperus difformmis followed by Andropogon gayanus. These are the indicator species of this group. The latter is composed of 34 species, 14 woody and 20 herbaceous. The woody layer is dominated by B. rufescens trees with an average height of 5.4 meters and an average cover of 5.40% (Figure 6).
Group G2: Characterizes the flora of the forest gallery. Analysis shows a dominance of Poaceae and Mimosaceae, with 32.7% and 23.2% respectively. Therophytes and Mesophanerophytes (Th: 58.2%; Mp : 45.8%) are the most dominant biological types. Faidherbia albida and Ipomoea are among them. Aquatica are the indicator species for this group. This group is composed of 13 species, 6 woody and 7 herbaceous. The woody layer is dominated by Faidherbia albida trees with an average density of 90.4 individuals /ha and an average diameter of 114.3 cm. Group G3: Characterizes the flora of the tree-to-shrub savanna. Analysis shows a dominance of Poaceae and Mimosaceae with 13.7% and 9.25% respectively. Therophytes and Mesophanerophytes (Th: 76.3%; Mp: 15.8%) are the most dominant biological types. Vachellia tortilis and Fimbristylis Littoralis are the indicator species for this group. This group is composed of 10 species, 3 woody and 7 herbaceous. The woody layer is dominated by Vachellia plants. Tortilis with an average density of 78.9 individuals /ha and an average diameter of 67.1 cm. Group G4: Characterizes the flora of the irrigated cultivation area. Flora analysis reveals a dominance of Amaranthaceae (23.7%), Therophytic Vines (Lth: 12.3%), Nanophanerophytes (na: 9.45%), and Geophytes (Gb: 4.45%) as the most represented biological types. Hyphaene thebaica and Amaranthus spinosus are the indicator species of this grouping (Figure 6).
Diversity and Equity Analysis
Analysis shows that group G1 exhibits the highest diversity index and richness (H’ = 4.6, S = 34), associated with high evenness (E = 0.9) and a significant Hmax (5.1). Conversely, these are low in group G2 (H’ = 2.8; E = 0.76; S = 13; Hmax = 3.70) and group G3 (H’ = 2.5; E ≈ 0.75; S = 10; Hmax ≈ 3.32). Finally, group G4 exhibits medium diversity (H’ = 3.0; S = 12; Hmax ≈ 3.58) and relatively high evenness (E ≈ 0.84) (Figure 7).
DISCUSSION
Land use dynamics
The results of this study highlight a highly contrasting spatio-temporal dynamic of land cover units in the Crowned Crane’s range between 1986 and 2026. The observed evolution is structured into three major periods (1986–2000, 2000–2022, and 2022–2026), reflecting progressive but non-linear ecological transformations resulting from the interaction between climate variability, hydrological fluctuations, and increasing anthropogenic pressures. This dynamic reflects a profound revegetation of Sahelian landscapes, characterized by a continuous decline of wetlands in favor of xeric vegetation formations and human-modified areas. The period 1986–2000 is marked by a rapid transformation of hydromorphic systems toward drier formations. The results reveal low stability of temporary and permanent ponds, accompanied by significant conversions to gallery ponds forests and shrubby savannahs. This dynamic reflects an initial phase of ecological imbalance linked to the reduction of flooded areas and the decrease in soil hydromorphism. This trend is consistent with the observations of Saadou (1990, 1998) and Mahamane and Saadou (2008), who showed that the late 1980s and early 1990s correspond to a phase of high rainfall variability in Niger, characterized by persistent water deficits and a contraction of Sahelian wetlands. In the Diffa region, Ibrahim et al. (2018) also reported a significant reduction in temporary ponds during this period, leading to a rapid modification of aquatic and semi-aquatic fauna habitats. The relative increase in galleries The shift from forests to shrubby savannas can be interpreted as an ecological response to declining surface water availability. The reduction in flood periods favors the establishment of plant species that are more drought-tolerant and less dependent on seasonal water regimes. This transition reflects a trend towards the progressive xerification of landscapes, a phenomenon widely documented in Sahelian ecosystems. From an ecological perspective, this initial phase marks the beginning of an alteration of habitats suitable for the Crowned Crane. The reduction of shallow pools and floodplains limits the species’ feeding and breeding areas, potentially leading to a decrease in the ecological quality of these habitats.
The period 2000–2022 corresponds to a phase of major landscape reconfiguration, characterized by alternating periods of relative stability and significant conversions between land cover units. Temporary ponds exhibit greater stability (33.4%), suggesting a slight improvement in hydrological conditions compared to the previous period. However, permanent ponds remain highly unstable, with marked transitions to savannas and temporarily flooded areas. One of the major findings of this period relates to the stabilization of gallery ponds forests (42.2%), reflecting a certain resilience of riparian formations to hydrological fluctuations. This resilience was also observed by Ali et al. (2016) in the floodplains of Niger, where gallery forests play an essential role in maintaining biodiversity and protecting soils against erosion.
However, this phase is also marked by an intensification of conversions towards irrigated Crops and shrub savannas reflect increasing human pressure on natural environments. These results corroborate those of Dan Lamso et al. (2015) and Boulenouar et al. (2020), who demonstrated a progressive expansion of agricultural activities in the formerly wetland areas of southern and southeastern Niger. The increase in hydro-agricultural development and the greater exploitation of water resources thus contribute to the fragmentation of natural habitats. Ecologically, this period corresponds to increased habitat fragmentation for the Crowned Crane. The decrease in functional connectivity between wetlands reduces the species’ mobility and limits access to food resources. Ecological corridors become more discontinuous, particularly in areas far from the main hydrographic network, exacerbating the vulnerability of local populations. This dynamic also reflects a transition towards increasingly human-modified landscapes, where natural habitats persist as fragmented mosaics. Such a spatial configuration can lead to a reduction in the ecological resilience of wetland ecosystems to future climate disturbances. The recent period (2022–2026) shows a particularly rapid and concerning dynamic. The results show high instability of aquatic habitats, with a massive conversion of temporary ponds to shrubby areas savannahs (70.7%) and the galleries forests (22.9%). Permanent ponds also undergo rapid transformations towards drier formations, reflecting a marked loss of hydrological stability.
This trend reflects a recent intensification of environmental pressures, likely linked to a combination of climate variability, rising temperatures, and increasing human pressure on natural resources. Similar trends were reported by Ousmane et al. (2021) in the Lake Chad Basin, where recent decades have been marked by an acceleration of wetland degradation and an expansion of secondary savannas. In Niger, Rabe et al. (2020) showed that the recent period is characterized by a sharp reduction in surface water availability, leading to a concentration of wetland-dependent species in increasingly restricted residual habitats. This situation is particularly critical for the Crowned Crane, a species highly dependent on open, humid, and minimally disturbed habitats. The scale of the conversions observed during this short period suggests a recent acceleration of ecological degradation processes. This dynamic could lead, in the medium term, to a gradual disappearance of functional habitats favorable to the species, if no conservation and restoration measures are implemented.
Ecological corridors and spatial structuring of habitats
Analysis of ecological corridors reveals a spatial structure strongly dependent on the hydrographic network. Areas of high ecological permeability are concentrated mainly in the southwest and north of the study area, corresponding to sectors where remnants of relatively connected wetland habitats still persist. This spatial organization reflects the central role of hydrological axes in maintaining the ecological connectivity of Sahelian landscapes. Similar observations were reported by Mahamat et al. (2017) in the Komadougou region. Yobé, where riparian corridors constitute essential refuge areas for biodiversity. Conversely, the fragmentation observed in the eastern and western margins reflects a progressive disruption of ecological continuity. This phenomenon, already described by Issa et al. (2020) in Niger, is primarily linked to agricultural intensification, the expansion of cultivated areas, and the depletion of water resources. The disruption of corridors limits wildlife movement and reduces the species’ capacity to adapt to environmental changes.
Species-environment relationships and water dependence of the Crowned Crane
Statistical analyses confirm a significant dependence of Crowned Crane abundance on environmental variables, including NDVI, NDWI, and distance to water. This relationship remains constant across all study periods but becomes particularly critical during the recent period (2022–2026), marked by a sharp reduction in wetlands. These results confirm that water availability is the main ecological factor structuring the species’ spatial distribution. They are consistent with the work of Cresswell (2012) and Meine and Archibald (1996), which emphasize that cranes are highly dependent on shallow wetlands for feeding, resting, and breeding.
In Niger, Ibrahim et al. (2018) and Rabe et al. (2018) also showed that proximity to water sources is the major determinant of the presence of the Crowned Crane. The reduction of flooded areas thus leads to a concentration of individuals in residual habitats, increasing the risks of competition, human disturbance, and degradation of nesting sites. Furthermore, the positive relationship between species abundance and vegetation indices indicates that habitats with relatively dense vegetation cover offer more favorable ecological conditions, particularly in terms of food availability and protection against disturbance. Temporal analysis shows an overall trajectory of progressive degradation and fragmentation of aquatic habitats in the study area. This dynamic is accompanied by a continuous expansion of shrub and tree savannas, reflecting a structural transformation of Sahelian landscapes. Such a trend has already been documented in several regions of Niger (Saadou, 1998; Mahamane and Saadou, 2008; Ali et al., 2016) as well as in the Lake Chad Basin (Boulenouar et al., 2020; Ousmane et al., 2021). The Crowned Crane thus appears as a sentinel species of Sahelian wetlands, whose distribution and abundance closely reflect landscape transformations and the conservation status of wetland ecosystems. The results show that the period 2022–2026 constitutes a critical phase marked by an acceleration of habitat loss and a decrease in ecological connectivity.
Structure and diversity of vegetation in the habitats of the Crowned Crane
Phytosociological analysis reveals a marked ecological structuring of Crowned Crane habitats into four distinct plant communities, organized primarily according to hydrological, edaphic, and anthropogenic gradients. Principal Component Analysis (PCA), performed on 54 surveys and 88 species, shows that axes 1 and 2 explain 34.9% and 28.8% of the total variability, respectively, for a cumulative contribution of 62.7%, reflecting a strong ecological differentiation of land cover units. This structuring is consistent with work carried out in the Sahelian ecosystems of Niger by Saadou (1990), Mahamane and Saadou (2008), and Ambouta et al. (2013), which demonstrated that water availability, soil texture, and the intensity of anthropogenic pressures are the main factors differentiating Sahelian plant communities. The results obtained show that group G1, associated with temporary and permanent ponds, exhibits the highest floristic richness and diversity indices (H’ = 4.6; E = 0.9; S = 34), reflecting the major ecological role of wetlands in maintaining plant biodiversity. The dominance of Cyperaceae, hydrophytes, and microphanerophytes confirms the determining influence of water conditions on floristic composition. Similar results were observed in the wetlands of the Komadougou Valley. Yobé and the Lake Chad Basin, where hygrophilous formations constitute habitats of high biological productivity favorable to aquatic and avian fauna (Ibrahim et al., 2018; Rabe et al., 2020). Indicator species such as Balanites rufescens, Cyperus difformis, and Andropogon gayanus indicate a relatively stable and undisturbed environment, favorable to the feeding and reproduction of the Crowned Crane. Conversely, groups G3 and G4, corresponding respectively to wooded to shrubby savannas and irrigated agricultural areas, exhibit lower levels of diversity and a marked dominance of therophytes, reflecting significant ecological disturbance. The predominance of therophytes in the savannas (76.26%) confirms the observations of Mahamane (2005) and Saadou (1998), according to which Sahelian ecosystems subjected to recurring droughts, overgrazing, and agricultural pressure gradually evolve towards simplified plant formations dominated by opportunistic annual species. The presence of species such as Vachellia tortilis, Fimbristylis littoralis and Amaranthus spinosus reflects an adaptation of plant communities to xeric conditions and increasing anthropogenic disturbances. Furthermore, the G2 gallery forest group exhibits an intermediate structure characterized by the dominance of Faidherbia albida and Mimosaceae, confirming the ecological role of riparian formations in maintaining biological corridors and soil fertility, as also demonstrated by the studies of Dan Guimbo et al. (2010) in the Niger River basin. The high density and large diameter of Faidherbia albida individuals indicate a certain ecological maturity of these formations, despite the anthropogenic pressures observed in riparian zones. Overall, the results show that wetland habitats and gallery forests constitute the main reservoirs of plant biodiversity in the study area and represent the most favorable habitats for the Crowned Crane. Conversely, the expansion of degraded savannas and agricultural areas reflects a progressive simplification of plant communities and a trend towards the aridification of Sahelian landscapes. This ecological dynamic, already observed in several regions of Niger and the Lake Chad Basin (Mahamane and Saadou, 2008; Ali et al., 2016; Boulenouar et al., 2020), could in the long term reduce the availability of functional habitats necessary for the maintenance of Crowned Crane populations and compromise the ecological resilience of Sahelian wetlands.
CONCLUSION
This study reveals a marked spatio-temporal dynamic of land cover units in the Crowned Crane’s range between 1986 and 2026, characterized by a progressive regression of permanent ponds and irrigated agricultural land in favor of savanna formations and human-modified areas. Diachronic analyses show that permanent ponds have undergone significant instability during the different periods studied, reflecting a continuous degradation of hydromorphic systems under the combined effect of climatic fluctuations, hydrological variability, and the intensification of human activities. The period 1986–2000 corresponds to an initial phase of ecological transformation marked by a reduction in floodplains and an expansion of shrub savannas and gallery forests. Between 2000 and 2022, the landscape underwent a significant reconfiguration characterized by vegetation fragmentation and an intensification of conversion to irrigated agricultural areas. Finally, the recent period (2022–2026) shows a worrying acceleration of ecological degradation processes, with a massive conversion of temporary ponds to savanna formations, reflecting a rapid loss of hydrological stability. Analysis of ecological corridors shows that habitat connectivity remains highly dependent on the hydrographic network, while peripheral areas are experiencing increasing fragmentation, limiting wildlife movement. Statistical results also confirm a strong dependence of the Crowned Crane on environmental variables related to water and vegetation, particularly NDVI, NDWI, and proximity to water points. The reduction of permanent ponds thus leads to a progressive concentration of individuals in increasingly restricted and vulnerable residual habitats. These results therefore underscore the urgent need to strengthen conservation and ecological restoration strategies through the protection of wetlands, the restoration of ecological corridors, the sustainable management of water resources, and the limitation of agricultural expansion in sensitive habitats. This study makes an important contribution to the understanding of landscape dynamics in Sahelian ecosystems and provides useful scientific bases for territorial planning, sustainable wetland management and biodiversity conservation in the Lake Chad Basin.
REFERENCES
Ali A., Mahamane A., Saadou M., Yacouba H. (2016). Dynamics of riparian formations and resilience of floodplain ecosystems in Niger. International Journal of Biological and Chemical Sciences, 10: 1654–1668.
Ambouta K., Mahamane A., Saadou M. (2013). Dynamics of Sahelian ecosystems and natural resource management in Niger. Sahel Journal of Environmental Sciences, 8: 45–58.
Arouna O. (2012). Analysis of land cover dynamics in tropical ecosystems. Remote Sensing, 10: 155–167.
Ben Moustapha M. (2016). Distribution of the species associated with Phlomis aurea Decne along an elevation gradient in Southern Sinai, Egypt. Ecologia Mediterranea, 42: 65–78.
Biaou S., Houinato M., Toko I. (2017). Assessment of land degradation in West Africa. Africa Science, 13: 78–91.
BirdLife International. (2020). Species factsheet: Balearica pavonina. BirdLife International.
Boulenouar A., Ousmane B., Mahamat A. (2020). Wetland dynamics and agricultural expansion in the Lake Chad Basin. Africa Science, 17: 85–98.
Boulweydou I. (2008). Phytosociological study of Sahelian plant formations in Niger (Master’s thesis). Université Abdou Moumouni.
Boussougou G.B. (2017). Environmental changes and dynamics of Sahelian landscapes. African Journal of Environment, 5: 23–37.
Brandt M., Mbow C., Diouf A.A., Verger A., Samimi C., Fensholt R. (2015).. Ground- and satellite-based evidence of Sahel greening from 1982 to 2011. Global Change Biology, 21: 1610–1620.
Braun-Blanquet J. (1932). Plant sociology: The study of plant communities. McGraw-Hill.
Chalifoux S., Nastev M., C. Lamontagne, R. Latifovic, R. Fernandes (2006). Cartographie de l'occupation et de l'utilisation du sol par imagerie satellitaire Landsat en hydrogéologie. Télédétection, 6: 9-17.
Chatelain C. (1996). High-resolution satellite imagery for vegetation studies (Doctoral dissertation). University of Geneva.
Coe M.T., Foley J.A. (2001). Human and natural impacts on the water resources of the Lake Chad Basin. Journal of Geophysical Research, 106: 3349–3356.
Cresswell W. (2012). Bird ecology and conservation in African wetlands. Cambridge University Press.
Dajoz R. (2003). Précis d’écologie (8e éd.). Dunod.
Dan Guimbo I., Mahamane A., Ambouta K. (2010). Structure and dynamics of niger river formations. Sécheresse, 21: 185–193.
Dan Lamso N., Mahamane A., Ambouta K. (2015). Expansion of irrigated crops in Niger. Sécheresse, 26: 211–220.
Foley J.A., DeFries R., Asner G.P., Barford C., Bonan G., Carpenter S.R., Snyder P.K. (2005). Global consequences of land use. Science, 309: 570–574.
Food and Agriculture Organization (1996). Forest resources assessment 1990. FAO.
Food and Agriculture Organization (2020). The state of food and agriculture 2020. FAO.
Frontier S., Pichod-Viale D., Alain Leprêtre, Dominique Davoult, C. Luczak (2008). Ecosystems: Structure, functioning and evolution. Dunod.
Giannini A., Biasutti M., Verstraete M.M. (2008). A climate model-based review of drought in the Sahel: Desertification, the re-greening and climate change. Global and Planetary Change, 64: 119–128.
Girard M.C., Girard C.M. (1999). Traitement des données de télédétection. Dunod.
Gordon J., Shortliffe E. (1985). Probabilistic reasoning in classification systems. Artificial Intelligence, 26: 323–357.
Grall J., Coïc N. (2005). Méthodes d’évaluation de la qualité du benthos. Ifremer.
Hanania S., Kumar K.H.Y., Daija K. (2022). Accuracy assessment of land cover classification and change detection using remote sensing and GIS. In Int. Conf. on Emerging Trends in Engineering (ICETE-2021).
Hansen M.C., Potapov P.V., Moore R., Hancher M., Turubanova S.A., Tyukavina A., Townshend J.R.(2013). High-resolution global maps of 21st-century forest cover change. Science, 342:850–853.
Herrmann S.M., Anyamba A., Tucker C.J. (2014). Recent trends in vegetation dynamics in the African Sahel and their relationship to climate. Global Environmental Change, 15: 394-404.
Huston M. (1994). Biological diversity. Cambridge University Press.
Ibrahim D., Mahamane A., Saadou M. (2018). Dynamics of ponds and crowned crane distribution in Niger. International Journal of Innovative and Applied Studies, 24: 456–468.
Inoussa M.M. (2011). Floristic diversity of Sahelian formations in Niger (Doctoral dissertation). Université Abdou Moumouni.
Intergovernmental Science-Policy Platform on Biodiversity and Ecosystem Services (2019). Global assessment report on biodiversity and ecosystem services. IPBES.
International Union for Conservation of Nature (2022). The IUCN Red List of Threatened Species: Balearica pavonina. IUCN.
Issa S., Ousmane B., Yamba B. (2020). Ecological fragmentation in Sahelian landscapes in Niger. African Journal of Environment and Agriculture, 3: 44–57.
Kioko J., Okello M. (2010). Land cover classification in savannas. African Journal of Ecology, 48: 345–356.
Kpedenou K.D., Ahe P., Boukpessi T. (2016) spatio-temporal dynamics of land use/land cover in southeastern Togo: mapping test using spatial remote sensing. Ahoho Journal, 16: 131-143.
Lambin E.F., Geist H.J. (2006). Land-use and land-cover change: Local processes and global impacts. Springer.
Leblanc M., Lemoalle J., Bader J.C., Tweed S., Mofor L. (2011). Thermal remote sensing of water under flooded vegetation: New observations of inundation patterns for the ‘Small’Lake Chad. Journal of Hydrology, 404: 87-98.
Legendre P. (1998). Numerical ecology. Elsevier.
Magurran A.E. (2004). Measuring biological diversity. Blackwell Publishing.
Mahamane A. (2005). Phytosociological studies of the vegetation of Niger (Doctoral dissertation). Free University of Brussels.
Mahamane A., Saadou M. (2008). Dynamics of Sahelian plant formations in Niger. Sécheresse, 19: 97–104.
Mahamane A., Saadou M. (2008). Dynamics of Sahelian vegetation in Niger. Annales de l’Université de Niamey, 13: 35–49.
Mahamat A., Ali A., Abdoulaye D. (2017). Ecological connectivity in Komadougou Yobe. Journal of Environmental Studies, 12: 101–115.
Masharabu, T. (2010). Plant diversity in tropical ecosystems. Geo-Eco-Trop, 34: 45–59.
Meine C.D., Archibald G.W. (1996). The cranes: Status survey and conservation action plan. IUCN/ICF.
Millennium Ecosystem Assessment (2005). Ecosystems and human well-being: Synthesis. Island Press.
Morou B. (2010). Plant diversity in Sahelian ecosystems of Niger (Doctoral dissertation). Université Abdou Moumouni.
Oszwald J. (2005). Spatial analysis of land cover change. Cybergeo, 12: 1–15.
Ousmane B., Mahamat A., Ali M. (2021). Wetland degradation in the Lake Chad Basin. Africa Science, 18: 132–145.
Rabe M., Ibrahim D., Mahamane A. (2018). Distribution of the Crowned Crane in Niger. Sahel Journal of Ecology and Environment, 6: 23–36.
Rabe M., Ousmane B., Issa S. (2020). Wetland vulnerability in Niger. Sahel Journal of Environmental Sciences, 8: 77–91.
Raunkiaer C. (1934). The life forms of plants and statistical plant geography. Oxford University Press.
Ronald E. (2020). Supervised classification methods. International Journal of Remote Sensing, 41: 1821–1840.
Saadou M. (1990). Vegetation of drained environments in Niger (Doctoral dissertation). Université de Niamey.
Saadou M. (1998). Dynamics of Sahelian ecosystems in Niger. Sécheresse, 9: 87–96.
Schwal M. (2004). Floristic inventory methods. Journal of Ecology, 92: 455–468.
Shannon C.E., Weaver W. (1949). The mathematical theory of communication. University of Illinois Press.
Soumana I. (2011). Phytosociological study of Sahelian formations (DEA thesis). Université Abdou Moumouni.
Taugourdeau S. (2024). Agro-pastoral landscape transformation in the Sahel. Environmental Change Review, 18: 55–73.
Urban E.K., Fry C.H., Keith S. (1986). The birds of Africa (Vol. 2). Academic Press.